Do You Want to Live Next to the Museum?
- Ken Park
- Oct 8, 2024
- 4 min read
Updated: Oct 14, 2024

Museums are often seen as cultural treasures, adding depth to the intellectual and aesthetic fabric of a city. For many, the thought of living next to a museum conjures up images of frequent cultural experiences, easy access to history, and an overall enhanced quality of life. But does living near a museum really elevate day-to-day living, or does it come with hidden challenges? In U.S. cities, the answer is both—proximity to a museum can boost the quality of life, but it may also present some unexpected downsides, depending on the context.
The Urban Museum Premium
In major U.S. cities like New York, Washington D.C., or Chicago, proximity to renowned museums can significantly impact rent prices and the desirability of surrounding neighborhoods. These cultural hubs serve as magnets for tourists and affluent residents alike. Living near the Metropolitan Museum of Art in New York, for example, is not just about having access to one of the world’s greatest art collections—it’s also about residing in a prestigious area, often considered a cultural epicenter. As a result, neighborhoods near museums tend to command higher rent prices, with people willing to pay more for both cultural prestige and easy access to iconic institutions.
In addition to cultural benefits, urban museums often sit in well-developed areas with strong infrastructure. Residents can enjoy efficient public transportation, bustling cafes, restaurants, and other amenities that spring up around cultural landmarks. These areas are dynamic and desirable for professionals, students, and even retirees looking to stay active in the cultural scene.
However, urban museum life is not without its drawbacks. The very factors that make these areas attractive—tourists, commercialization, and bustling activity—can also create congestion, noise, and a sense of overcrowding. Residents may find themselves navigating throngs of visitors, dealing with traffic issues, and struggling with inflated costs for everyday items. Furthermore, the gentrification that often accompanies the establishment of a cultural district can drive up the cost of living, potentially pushing out lower-income residents and disrupting the social fabric of long-established communities.
Rural Museums and Community Life
In contrast, rural museums or those located in smaller towns offer a more localized experience, contributing significantly to community identity and pride. These museums, often focused on regional history or cultural heritage, serve as important educational resources and gathering spaces for residents. The presence of a museum in a rural town can bring economic benefits by attracting tourists and creating local jobs, albeit on a smaller scale than in urban centers.
For residents of rural areas, living near a museum may not come with the same rent premium seen in cities. The demand for proximity is typically lower in these areas, as other factors—such as land size, privacy, and access to nature—take priority. Instead of driving up housing prices, rural museums often serve as community anchors, enhancing the local quality of life through events, exhibitions, and educational programs without significantly altering the real estate market.
However, the benefits of living near a museum in a rural setting can be more seasonal. Some rural museums see fluctuations in visitor numbers, with peak tourist seasons offering an economic boost while the off-season brings relative quiet. As a result, the local housing market may remain steady without the dramatic shifts seen in urban areas.
So, which is more critical to rent prices—community or tourist-driven museums? In this article, we explore the distribution and concentration of museums across the U.S. using 2015 museum data from the Institute of Museum and Library Services. The analysis does not differentiate between types of museums but uses a categorization code ranging from 0 to 9 based on museum income for a rough analysis.
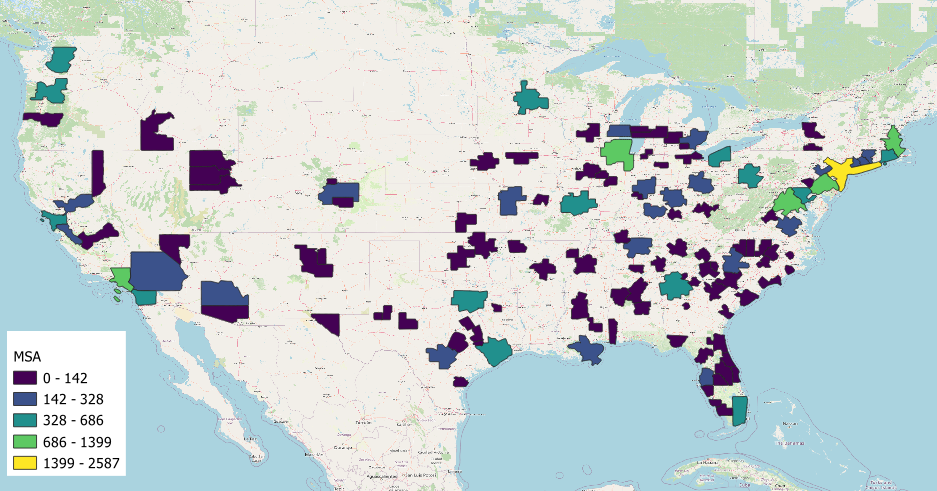
Figure. The number of museums per MSA
The metropolitan statistical areas (MSAs) of East Coast cities such as New York, Boston, and Philadelphia ranked first, second, and third, respectively, followed by cities like Los Angeles, Chicago, Washington, and San Francisco.
Rank | MSA Name | Number of Museums |
1 | New York-Newark-Jersey City, NY-NJ-PA | 2587 |
2 | Boston-Cambridge-Newton, MA-NH | 1399 |
3 | Philadelphia-Camden-Wilmington, PA-NJ-DE-MD | 1373 |
4 | Los Angeles-Long Beach-Anaheim, CA | 1189 |
5 | Chicago-Naperville-Elgin, IL-IN-WI | 1115 |
6 | Washington-Arlington-Alexandria, DC-VA-MD-WV | 1000 |
7 | San Francisco-Oakland-Berkeley, CA | 686 |
8 | Providence-Warwick, RI-MA | 491 |
9 | Seattle-Tacoma-Bellevue, WA | 481 |
10 | Dallas-Fort Worth-Arlington, TX | 463 |
The county rankings were somewhat interesting, with Los Angeles County and Cook County (Chicago) having the most museums, which shifted the city rankings.
Rank | County Name | MSA Name | Number of Museums |
1 | Los Angeles | Los Angeles-Long Beach-Anaheim, CA | 318 |
2 | Cook | Chicago-Naperville-Elgin, IL-IN-WI | 210 |
3 | New York | New York-Newark-Jersey City, NY-NJ-PA | 162 |
4 | Middlesex | Boston-Cambridge-Newton, MA-NH | 153 |
5 | San Diego | San Diego-Chula Vista-Carlsbad, CA | 135 |
6 | King | Seattle-Tacoma-Bellevue, WA | 116 |
7 | Suffolk | New York-Newark-Jersey City, NY-NJ-PA | 114 |
8 | Philadelphia | Philadelphia-Camden-Wilmington, PA-NJ-DE-MD | 114 |
9 | Cuyahoga | Cleveland-Elyria, OH | 102 |
10 | District of Columbia | Washington-Arlington-Alexandria, DC-VA-MD-WV | 96 |
Community Museum vs. Tourist Museum
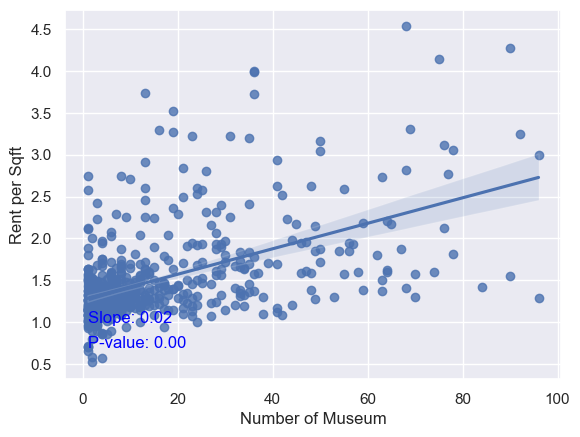
We examined the relationship between price per square foot and the number of museums by county using a scatter plot. To clarify the trend, we dropped areas that were disproportionately large compared to the rest of the data. The results showed a significantly increasing trend with a slope of 0.2 and a p-value of less than 0.00.
Figure. All museum vs. Rent per Sqft (coef. 0.02)
I wanted to analyze the data while minimizing the effect of tourism. To achieve this, I assumed that the bottom 30% income categories of museums, which were community-based museums with less tourist influence. Interestingly, the results showed a higher slope of 0.03 compared to the overall museum regression model, with a p-value of less than 0.00, indicating a significant trend.
Figure. Community museum vs. Rent per Sqft (coef. 0.03)
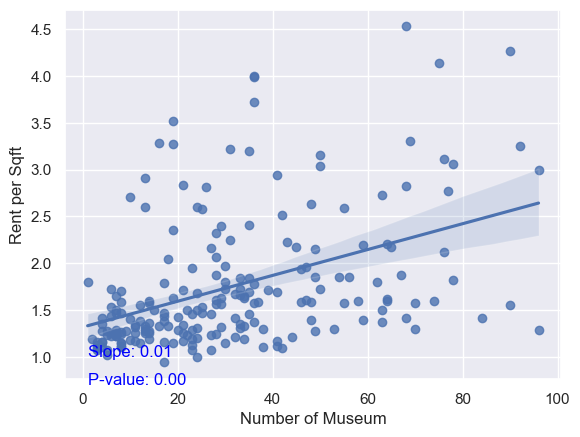
Next, I selected only the top 30% of museums in terms of revenue, which are categorized as tourist museums, and modeled the data accordingly. The results are shown in the following plot. The slope was 0.01, and it was statistically significant with a p-value of less than 0.00.
Figure. Tourist museum vs. Rent per Sqft (coef. 0.01)
Conclusion
The number of museums has a positive correlation with rent per square foot. Interestingly, smaller community-based museums, which generate lower revenue, tend to have a greater impact on increasing rent per square foot compared to larger, high-revenue tourist museums.


תגובות